Elasticity At The Wall View
The Elasticity At The Wall View (Advanced stress & failure > Borehole Stress > At the Wall) displays the results of the at the wall computation. The view is changing depending on the selections that were made on the At The Wall form.
In the Elasticity At The Wall View, all stress components on the borehole wall are shown as a function of the angle around the hole. This angle is measured clockwise from the bottom side of the hole looking down the borehole (or from the south if the well is vertical). The location around the hole where stmin is smallest defines the position of a potential tensile wall fracture (posTF). The maximum value of stmax determines the position of potential breakouts (posBO).
Additionally, you can also display the breakout position from the caliper log analysis on the borehole image and specify the deviation of the breakout position in MD. For more information, see Integration of caliper analysis with borehole stress.
The view consists of different areas:
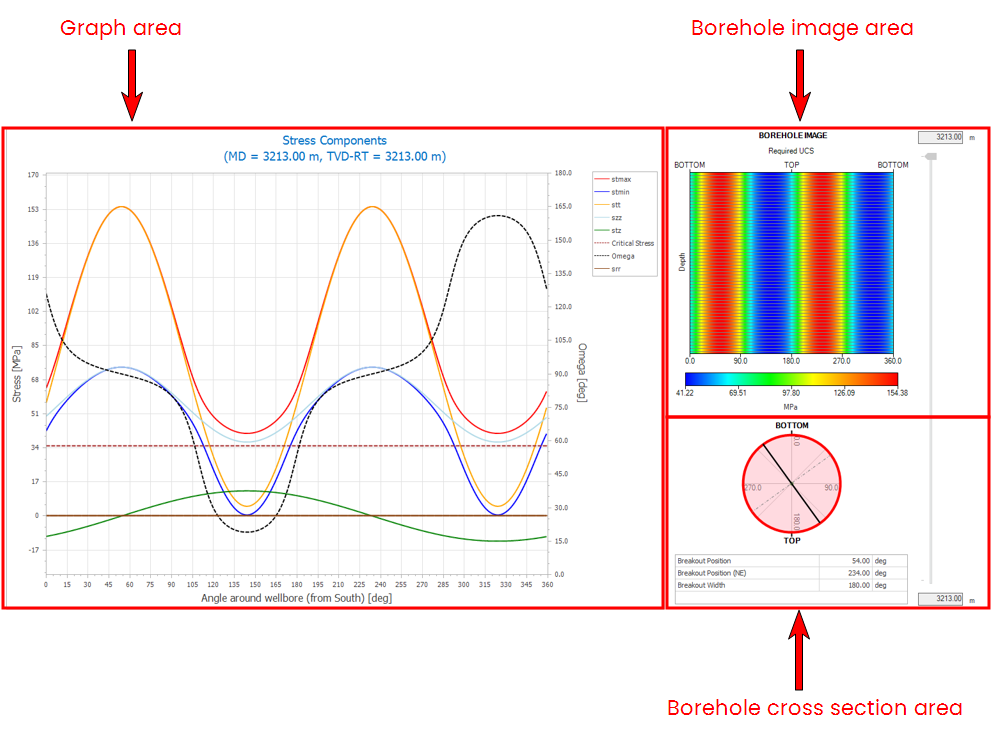
The different areas on the Elasticity At The Wall View. The view is a dedicated view that changes dynamically depending on the selected options and settings in the Borehole Stress sub-strip. click to enlarge
- The graph area - plotted in the graph area are Omega (secondary Y axis), and the effective stress components stmin, stmax, and srr. By definition, Omega is the angle with respect to the borehole axis of the maximum principal stress within the wall of the borehole, and is parallel to the induced fracture. The Omega axis is drawn on the right-hand side of the stress components graph, and the stress axis is drawn on the left-hand side of the graph. In addition, the left-hand plot displays the stress at the borehole wall above which compressive failure will occur (Critical Stress, shown as a red dotted line).
- The borehole image area - displays the calculated compressive strength required to prevent breakout initiation as an unwrapped image of the borehole wall. Compressive failure is predicted for orientations where any stress component exceeds the critical stress. When the borehole is in failure, it is visualized with light gray lines. Break outs are shown as white regions.
- The borehole cross section area - shows a cross section and a table displaying the breakout width and position calculated. When the borehole is in failure, it is visualized with a red representation of the borehole cross section.
The Elasticity View contains a toolbar that you can use to control the view. For more information, see Elasticity view toolbar. To view the input parameters and change the display settings of the view, use the options icon ![]() in the toolbar and the pane is visible on the right side of the view.
in the toolbar and the pane is visible on the right side of the view.
Display settings for Elasticity - At the Wall view
Click the options icon ![]() in the toolbar to show the pane on the right side of the view. The pane is divided in two tabs - Input and Display. The Input tab shows the input parameters used to model the wellbore failure due to compressive or tensile stresses at the wall. With the Display tab, you can control the visibility of stresses displayed on the graph, colorset of the borehole image and failure, reference position and caliper data range.
in the toolbar to show the pane on the right side of the view. The pane is divided in two tabs - Input and Display. The Input tab shows the input parameters used to model the wellbore failure due to compressive or tensile stresses at the wall. With the Display tab, you can control the visibility of stresses displayed on the graph, colorset of the borehole image and failure, reference position and caliper data range.
Visibility options
Stresses Show or hide the stresses that you want to plot on the graph area by checking the adjacent checkboxes.
Angles Show or hide the angle Omega on the graph area using the adjacent checkbox.
Failures Use the adjacent checkbox to show the intrinsic breakouts on the borehole image. You can show or hide the wellbore cross section, which shows the breakout position, by checking the adjacent checkbox.
Legend Shows or hides the Min and Max values in the legend for the series that are plotted on the graph.
Directions If your solution has caliper log data, you can show or hide the breakout position from the caliper analysis on the borehole image for comparison.
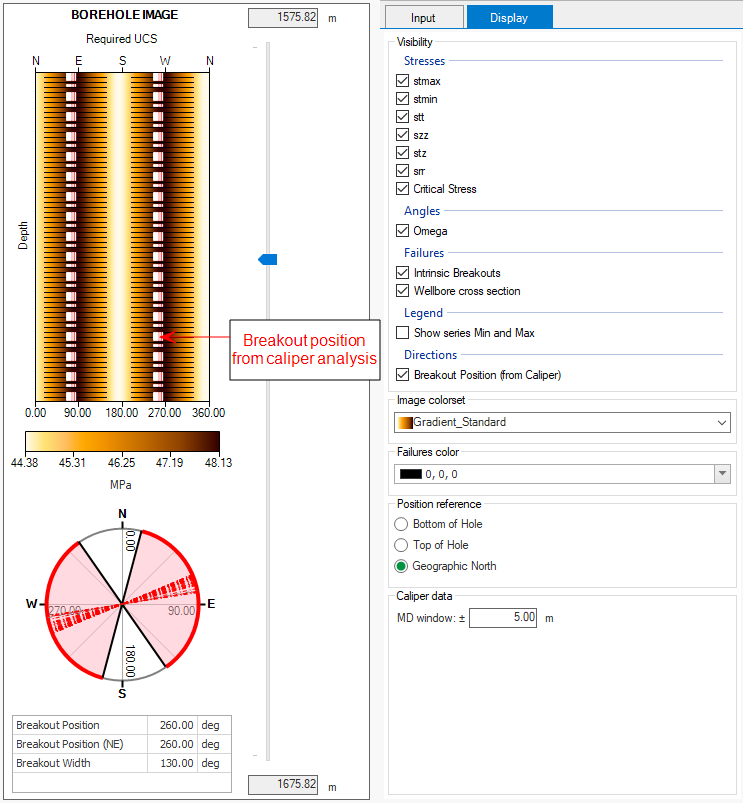
Example showing the breakout position from caliper analysis on the borehole image. click to enlarge
Image colorset and Failures color
Image colorset Select a colorset for the borehole image from the drop-down list .
Failures color Change the color of the borehole failures that are displayed on the borehole image. You can select a color from the drop-down list or enter the RGB colorset manually.
Position reference
Select one of the three options to set the reference position of the borehole cross section. The axis labels are updated based on the selection.
- Bottom of hole
- Top of hole
- Geographic North
Caliper data
MD window (±) Specify the deviation of the breakout position from the caliper log analysis.